Three sticky notes with the words supply chain, analytics, and reinforcement learning

Teaching

Step into my classroom. I mentor the business and engineering community at all levels. Explore my approach to developing quantitative decision makers.

Overview

Quantitative analysis often feels out of reach. But with the right approach, anyone—regardless of background—can access the insights that mathematics offers.

In my classroom, I simplify complex ideas without sacrificing rigor. Equations serve as a bridge to understanding rather than a barrier to curiosity.

Multi-colored stick figures drawn with a marker

Stylized Analysis

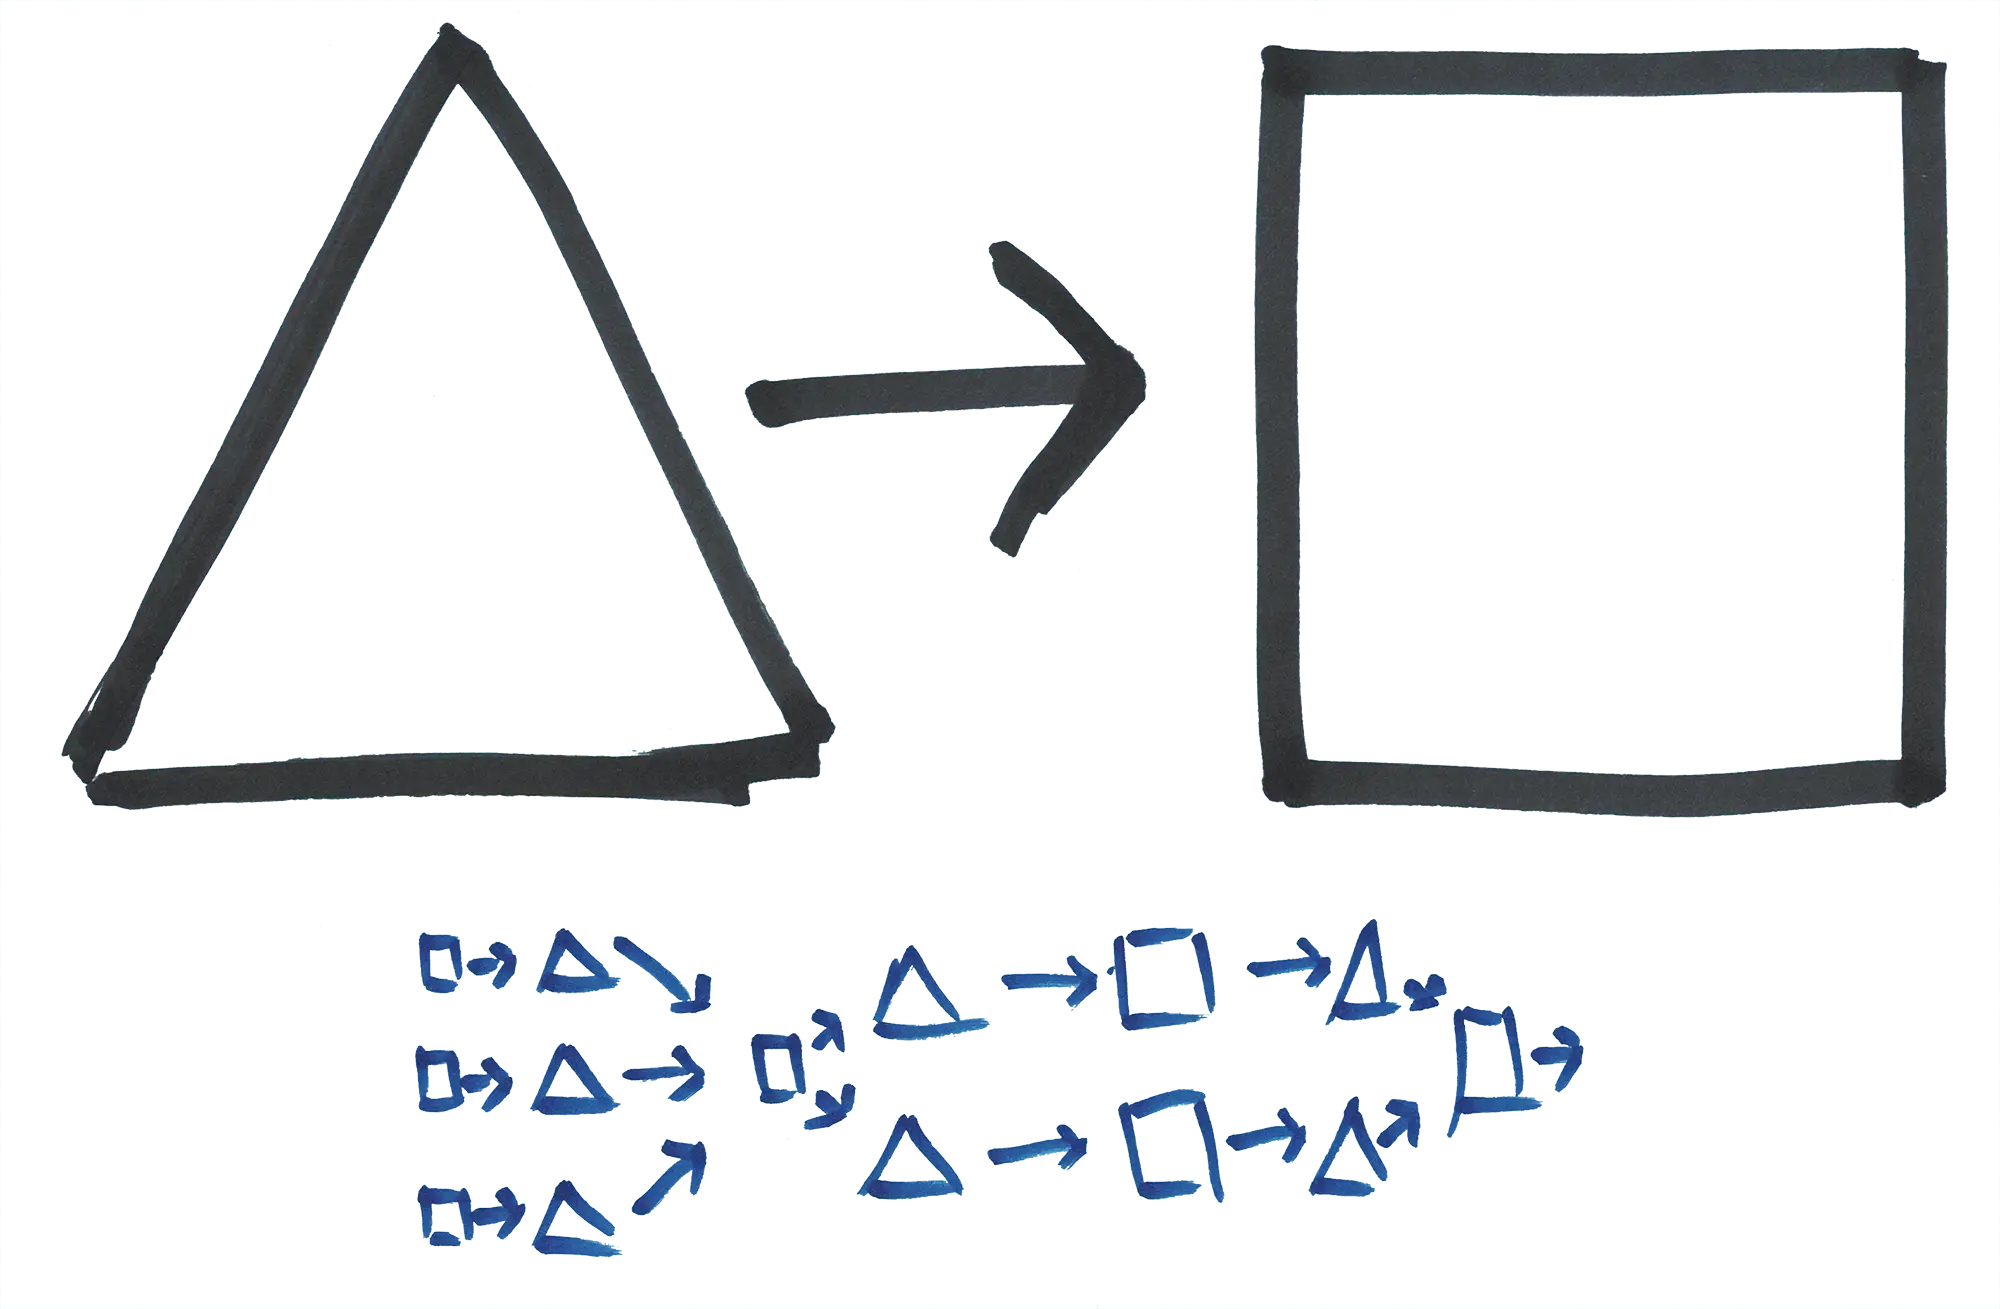
Begin here: Strip away unnecessary complexity to reveal the essential trade-offs. Mine this simplified setting for insight.

Then: Restore the complexity. Apply the same insights to increasingly realistic problems and real-world decisions.

A simple process flow diagram and a complex process flow diagram

Visual Intuition

The philosophy: Equations should be seen, not just solved.

In practice: Replace static symbols with interactive exploration. Animate random variables through simulation. Use Monte Carlo experiments to make calculus visible.

The result: Visual exploration turns abstract mathematics into intuitive concepts students can see, explore, and remember.

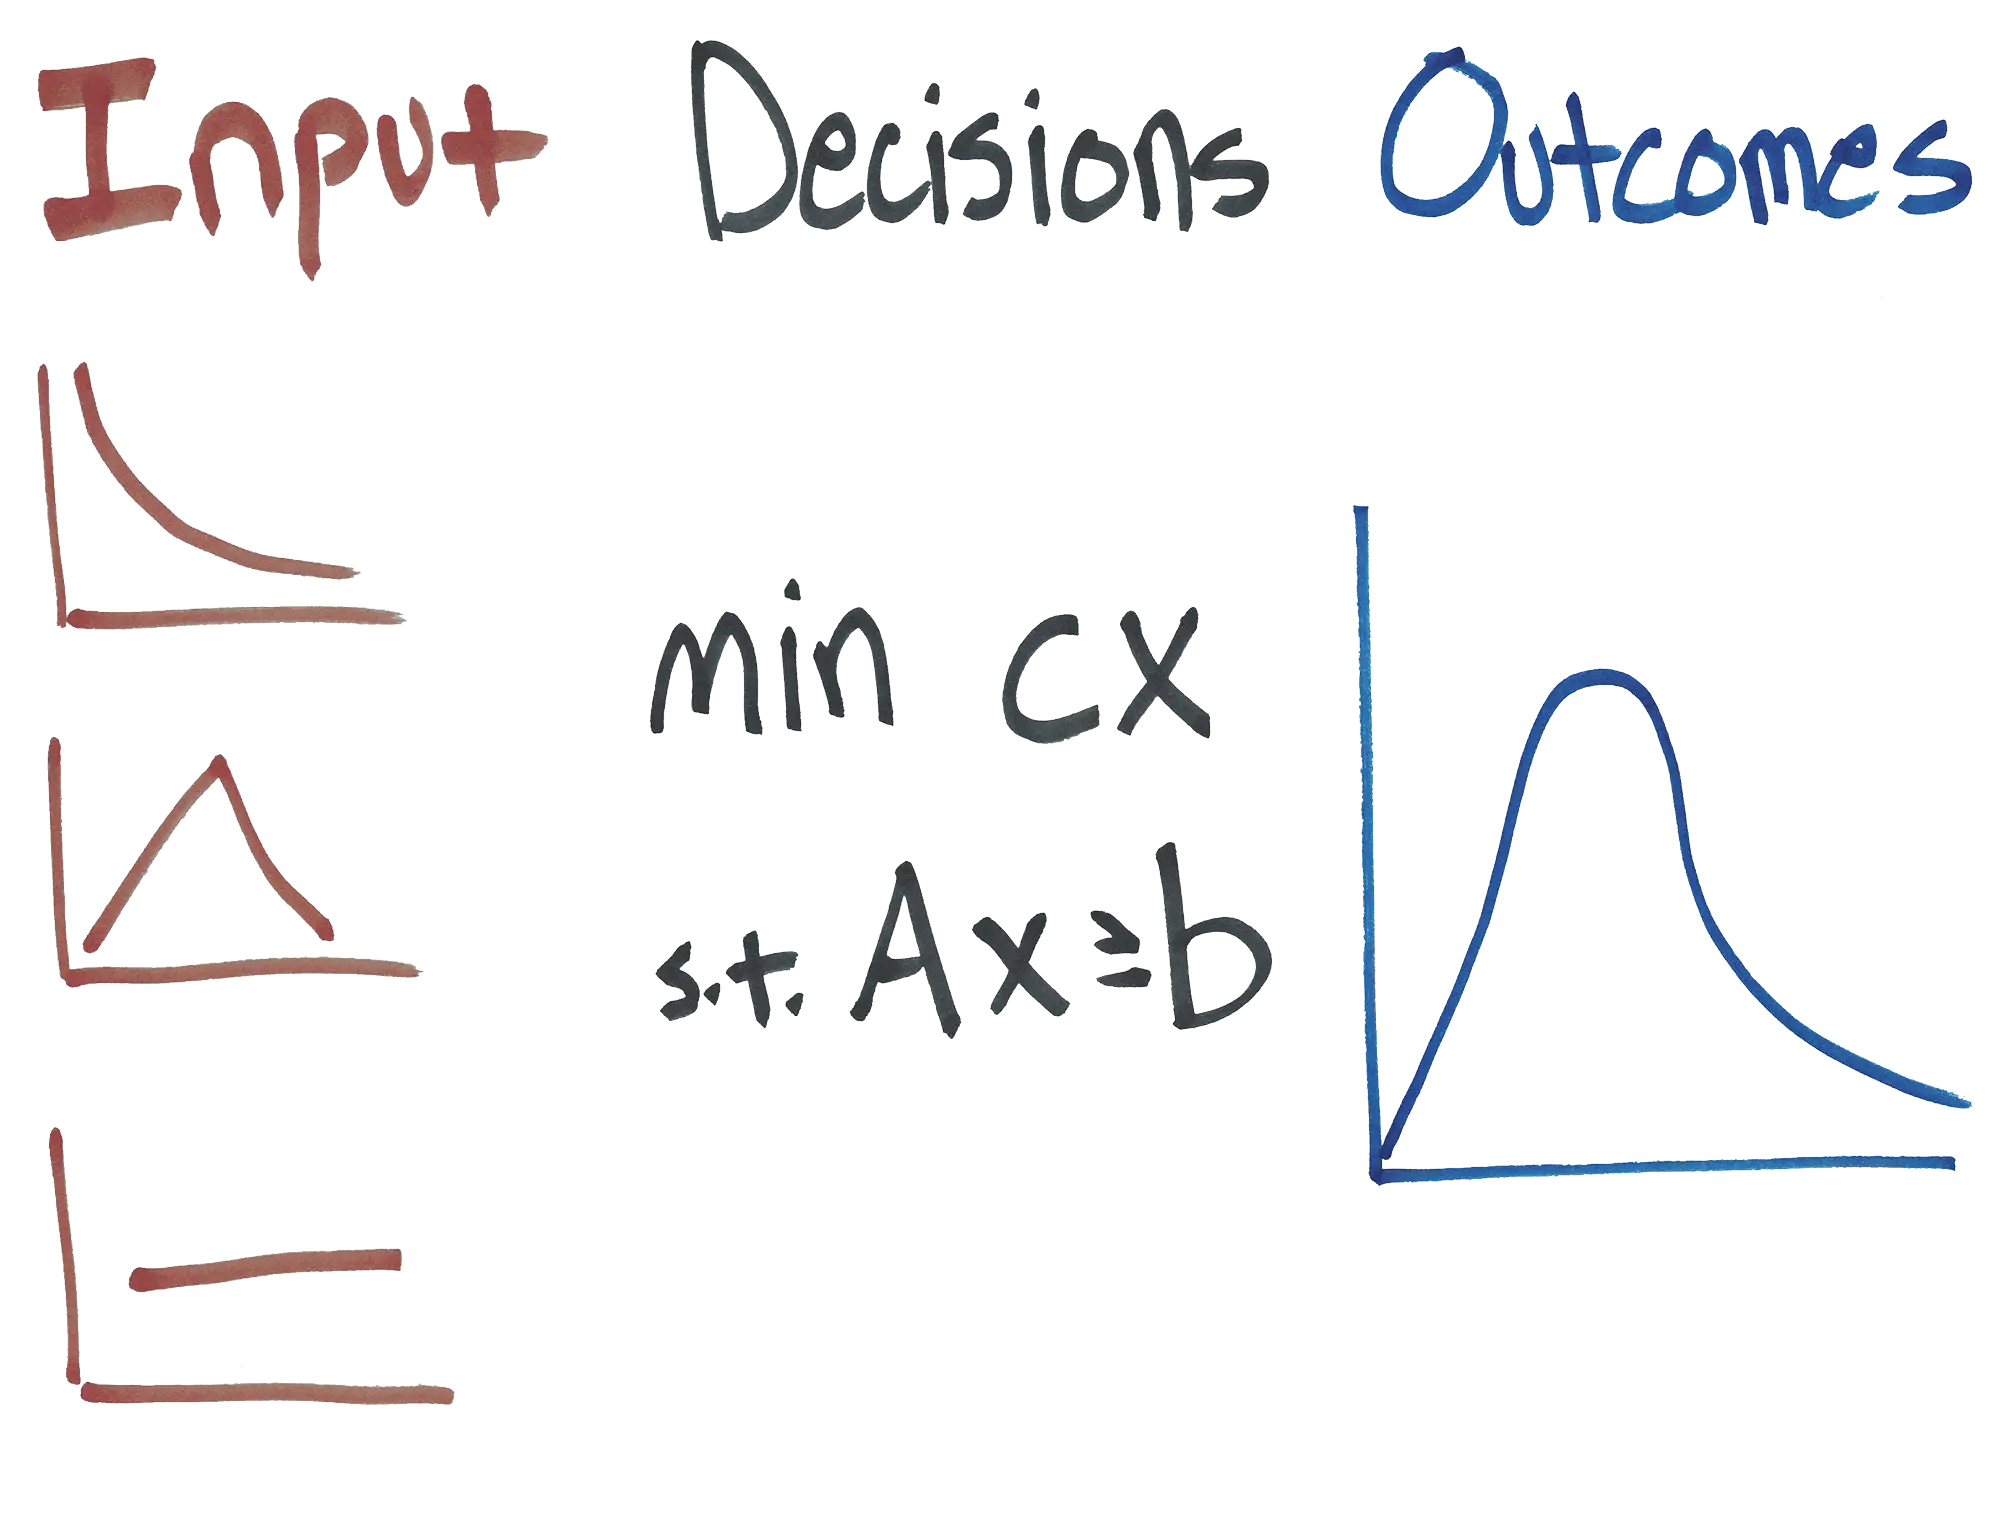
Illustration of a Monte Carlo simulation: inputs, decisions, and outcomes

Lasting Insight

Stylized analysis and visual intuition cut through the complexity of quantitative ideas. Students learn to recognize structure and transfer fundamental insights to new problems. The goal is not simply to pass the exam, but to develop quantitative thinking that lasts.

A graph showing optimal vaccine allocation in Missouri during the pandemic

Sequential Decision Problems

I deliver doctoral seminars at universities around the world on sequential decision making under uncertainty.

Such problems arise across business, engineering, the sciences, and health care, requiring choices that perform well not only in the present but across an entire horizon.

The course integrates optimal control, Markov decision processes, and reinforcement learning to develop core skills in modeling, policy design, and dual bounds. It connects deterministic optimization techniques with stochastic solution strategies, bridging classical methods with modern approaches.

One lecture on stochastic dynamic programming (a.k.a. reinforcement learning) delivered in May 2026 at the Università di Brescia. Topics include modeling, essential theory, policy classes, and dual bounds. Follow along with the notes packet.

Algorithms to Live By

This freshman seminar personalizes mathematics. How should we spend a day or a lifetime? What balance of new and familiar yields the most fulfillment? How much chaos can we manage? The seminar moves beyond the mechanics of math to the logic of living.

Mathematical structures appear throughout everyday life, but students rarely encounter them this way. I designed this course to bring those connections into focus, using exploration and exploitation, Bayesian reasoning, and optimal stopping to examine decisions about majors, apartments, careers, and relationships.

Algorithms to Live By sharpens the quantitative lens for everyday experience. The goal is not simply to learn algorithms, but to recognize the structures behind the decisions we make.

Saint Louis University offers Algorithms to Live By as one of many first-year seminars. In the videos above, faculty and students share their experiences with these unique courses. Explore the course's history in Universitas, SLU's alumni publication, and via a write-up on the Saint Louis University Core Curriculum. Not in my class? Follow our journey by reading the book that inspired the course.

Other Courses

One gear

Operations Management

How to match supply with demand at the firm level. Design, performance, and improvement of operations in manufacturing and service settings.

Undergraduate & Master's

Three gears

Supply Chain Management

How to match supply with demand across businesses. Managing the production, storage, and distribution of goods across a network of suppliers.

Master's

Cumulative graph

Advanced Analytics

How to use predictive and prescriptive analytics to guide the allocation of limited resources. Quantitative methods to transform data into insight for better decision making.

Master's

Pair of dice

Betting On Uncertain Demand

How to hedge against the unknown by laying down resources across a range of outcomes. Why forecasts are inevitably wrong and what to do about it.

Executive

Graph with two series

Managing Variability

How to reduce, buffer, and pool variability. Operational strategies to hedge against fluctuations in supply and demand.

Executive